There are different views about the relationship and evolution of reptiles and depending on the datasets used different phylogenetic relationships are found. Historically, morphological data has been used most, but more recently DNA or protein sequence data is the preferred source of information for phylogenetic analysis. Unfortunately, different genes evolve at different rates and thus trees derived from different data sets may result in contradictory phylogenetic hypotheses. For example, certain taxa (e.g., teiids) show a significant codon bias coupled with an increased relative rate of evolution of C-mos sequences compared to other squamates. This seems to distort attempts to use C-mos in phylogenetic analyses, both across squamates and within teiids (Harris 2003). Therefore, combined dataset using many sequences and/or morphological characters are usually most reliable.
The trees below have been derived from the combined analysis of mitochondrial protein coding genes and tRNAs.
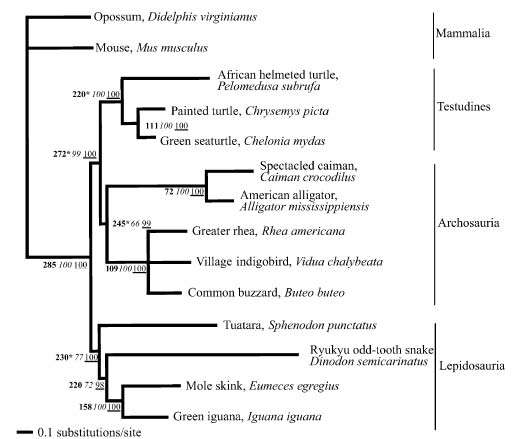
Figure 1: Optimal phylogenetic hypothesis for representative lineages of Reptilia using a Bayesian inference approach. For this figure, branch lengths have been calculated using a GTR+gamma model, with a dataset including 11 protein coding genes and 19 tRNAs from mitochondria. Numbers in bold at internodes are divergence time estimates in millions of years before the present. Asterisks designate calibration points from the fossil record (see Benton, 1993; Carroll, 1988). Numbers in italics are nonparametric bootstrapped Bayesian posterior probabilities (BPP) based on 100 replicates and 200,000 generations (see text). Bayesian posterior probabilities (PP) for nodes are underlined (from Rest et al. 2003).
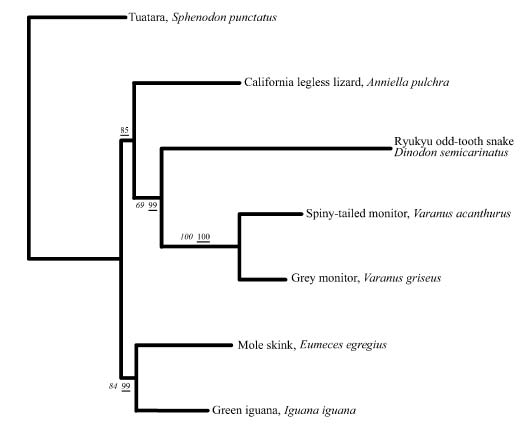
Figure 2: Optimal phylogenetic hypothesis for representatives of seven lineages of reptiles focusing on relative placement of snakes (e.g., Dinodon) using tuatara (Sphenodon) as an outgroup and a Bayesian inference approach. For this figure, branch lengths are calculated using a GTR+gamma model, with a dataset including two protein coding genes and eight tRNAs from mitochondria. Numbers in italics are nonparametric bootstrapped Bayesian posterior probabilities (BPP) based on 100 replicates and 200,000 generations. Bayesian posterior probabilities (PP) for nodes are underlined (from Rest et al. 2003).
Further information:
Benton, M.J., (1993)
The Fossil Record 2.
Chapman & Hall, New York.
Carroll, R.L. (1988)
Vertebrate Paleontology and Evolution.
W.H. Freeman, New York.
Rest, Joshua S.; Jennifer C. Ast; Christopher C. Austin; Peter J.
Waddell; Elizabeth A. Tibbetts; Jennifer M. Hay and David P. Mindell
(2003)
Molecular systematics of primary reptilian lineages and the
tuatara mitochondrial genome.
Molecular Phylogenetics and Evolution 29: 289-297
Stuart, Gary W.; Karen Moffett and Jeffery J. Leader (2002)
A Comprehensive Vertebrate Phylogeny Using Vector Representations
of Protein Sequences from Whole Genomes.
Mol. Biol. Evol. 19 (4):554-562
ZARDOYA, RAFAEL AND AXEL MEYER (2001)
The evolutionary position of turtles revised.
Naturwissenschaften 88:193-200
BACK to THE REPTILE DATABASE Top Page